Ward van Pelt
Associate professor
Recent work
We recently generated new glacier thickness and bed maps for Svalbard. See here for more details! 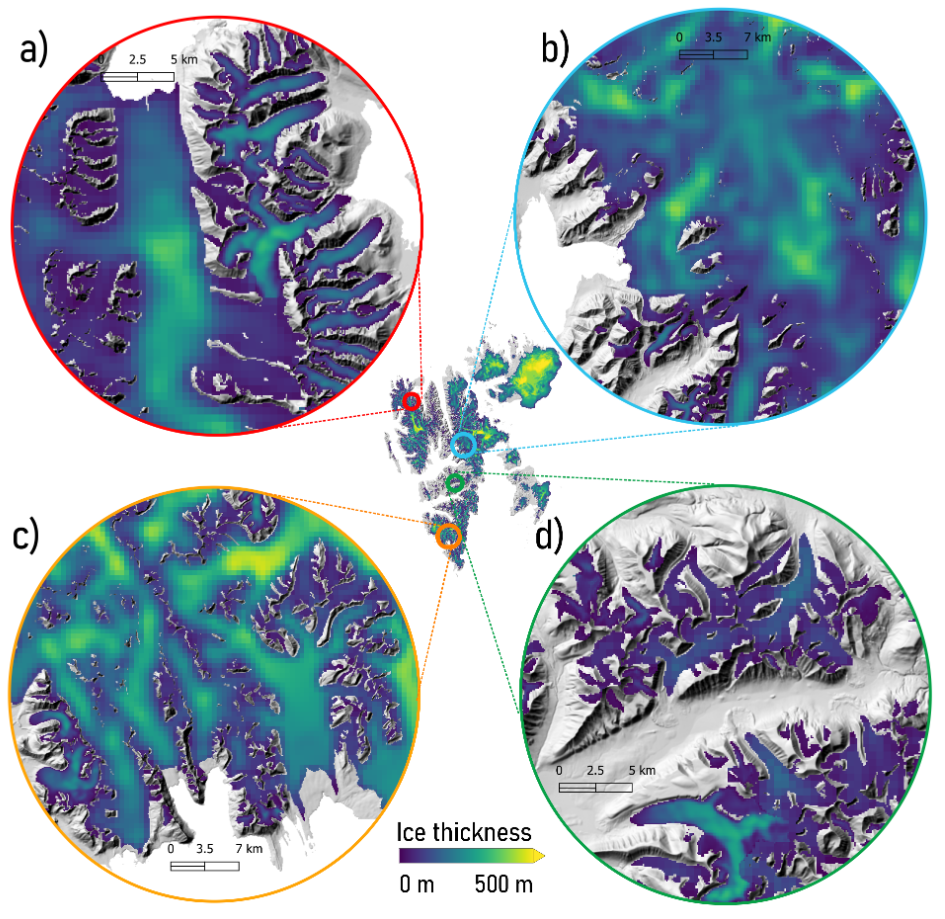
Have a look at our recent study on ice thickness inversion in Scandinavia! 
New glacier thickness and bed topography maps for Svalbard
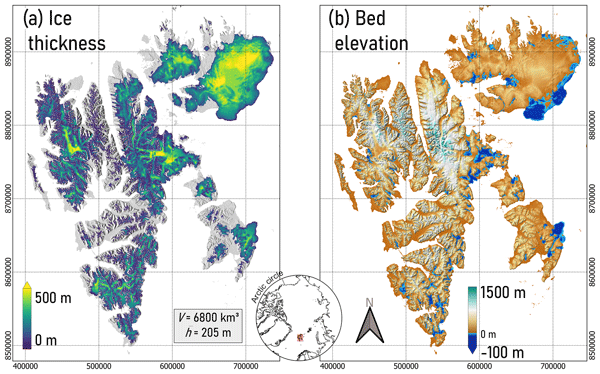
Knowledge of the thickness, volume, and subglacial topography of glaciers is crucial for a range of glaciological, hydrological, and societal issues, including studies on climate-warming-induced glacier retreat and associated sea level rise. This is not in the least true for Svalbard, one of the fastest-warming places in the world. Here, we present new maps of the ice thickness and subglacial topography for every glacier on Svalbard. Using remotely sensed observations of surface height, ice velocity, rate of surface elevation change, and glacier boundaries in combination with a modelled mass balance product, we apply an inverse method that leverages state-of-the-art ice flow models to obtain the shape of the glacier bed. Specifically, we model large glaciers with the Parallel Ice Sheet Model (PISM) at 500 m resolution, while we resolve smaller mountain glaciers at 100 m resolution using the physics-informed deep-learning-based Instructed Glacier Model (IGM). Actively surging glaciers are modelled using a perfect-plasticity model. We find a total glacier volume (excluding the island Kvitøya) of 6800 ± 238 km3, corresponding to 16.3 ± 0.6 mm sea level equivalent. Validation against thickness observations shows high statistical agreement, and the combination of the three methods is found to reduce uncertainties. We discuss the remaining sources of errors, differences from previous ice thickness maps of the region, and future applications of our results. Please find the article here: link
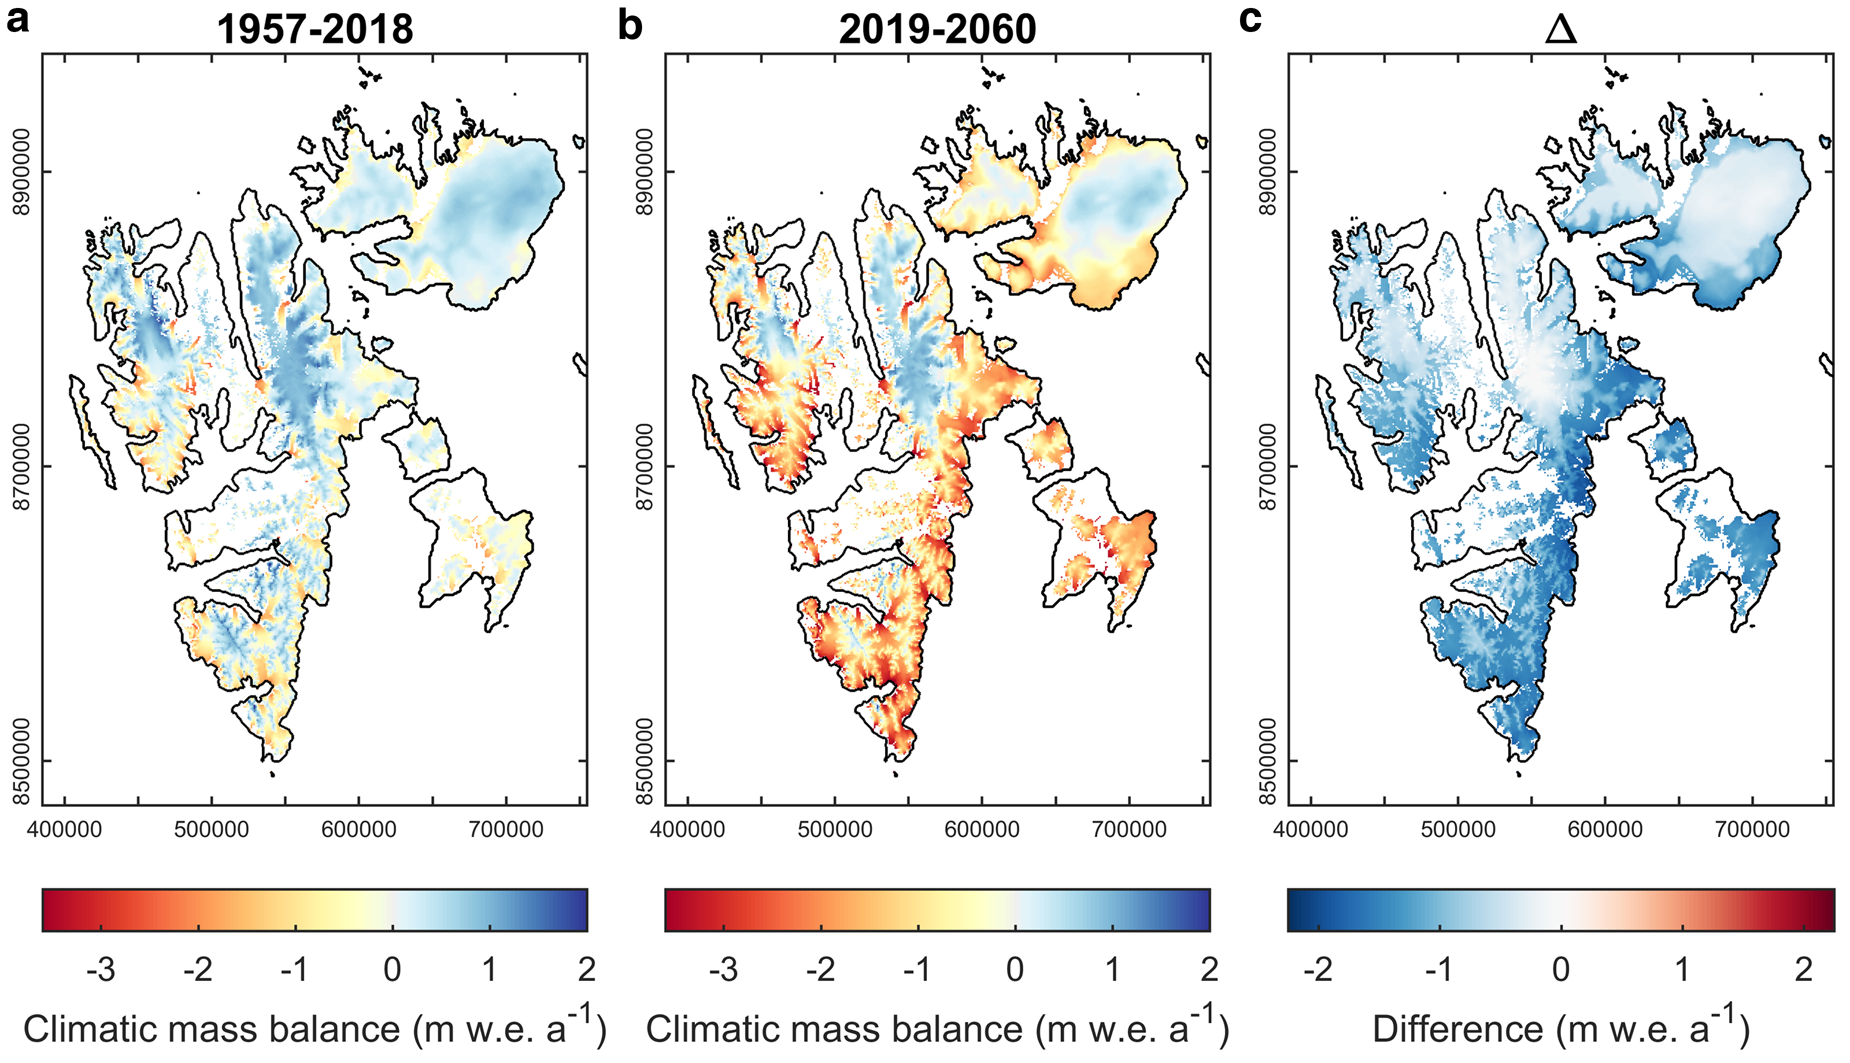
Accelerating future mass loss of Svalbard glaciers from a multi-model ensemble
Projected climate warming and wettening will have a major impact on the state of glaciers and seasonal snow in High Arctic regions. Following up on a historical simulation (1957–2018) for Svalbard, we make future projections of glacier climatic mass balance (CMB), snow conditions on glaciers and land, and runoff, under Representative Concentration Pathways (RCP) 4.5 and 8.5 emission scenarios for 2019–60. We find that the average CMB for Svalbard glaciers, which was weakly positive during 1957–2018, becomes negative at an accelerating rate during 2019–60 for both RCP scenarios. Modelled mass loss is most pronounced in southern Svalbard, where the equilibrium line altitude is predicted to rise well above the hypsometry peak, leading to the first occurrences of zero accumulation-area ratio already by the 2030s. In parallel with firn line retreat, the total pore volume in snow and firn drops by as much as 70–80% in 2060, compared to 2018. Total refreezing remains largely unchanged, despite a marked change in the seasonal pattern towards increased refreezing in winter. Finally, we find pronounced shortening of the snow season, while combined runoff from glaciers and land more than doubles from 1957–2018 to 2019–60, for both scenarios. Please find the article here: link
A long-term dataset of climatic mass balance, snow conditions, and runoff in Svalbard (1957–2018)
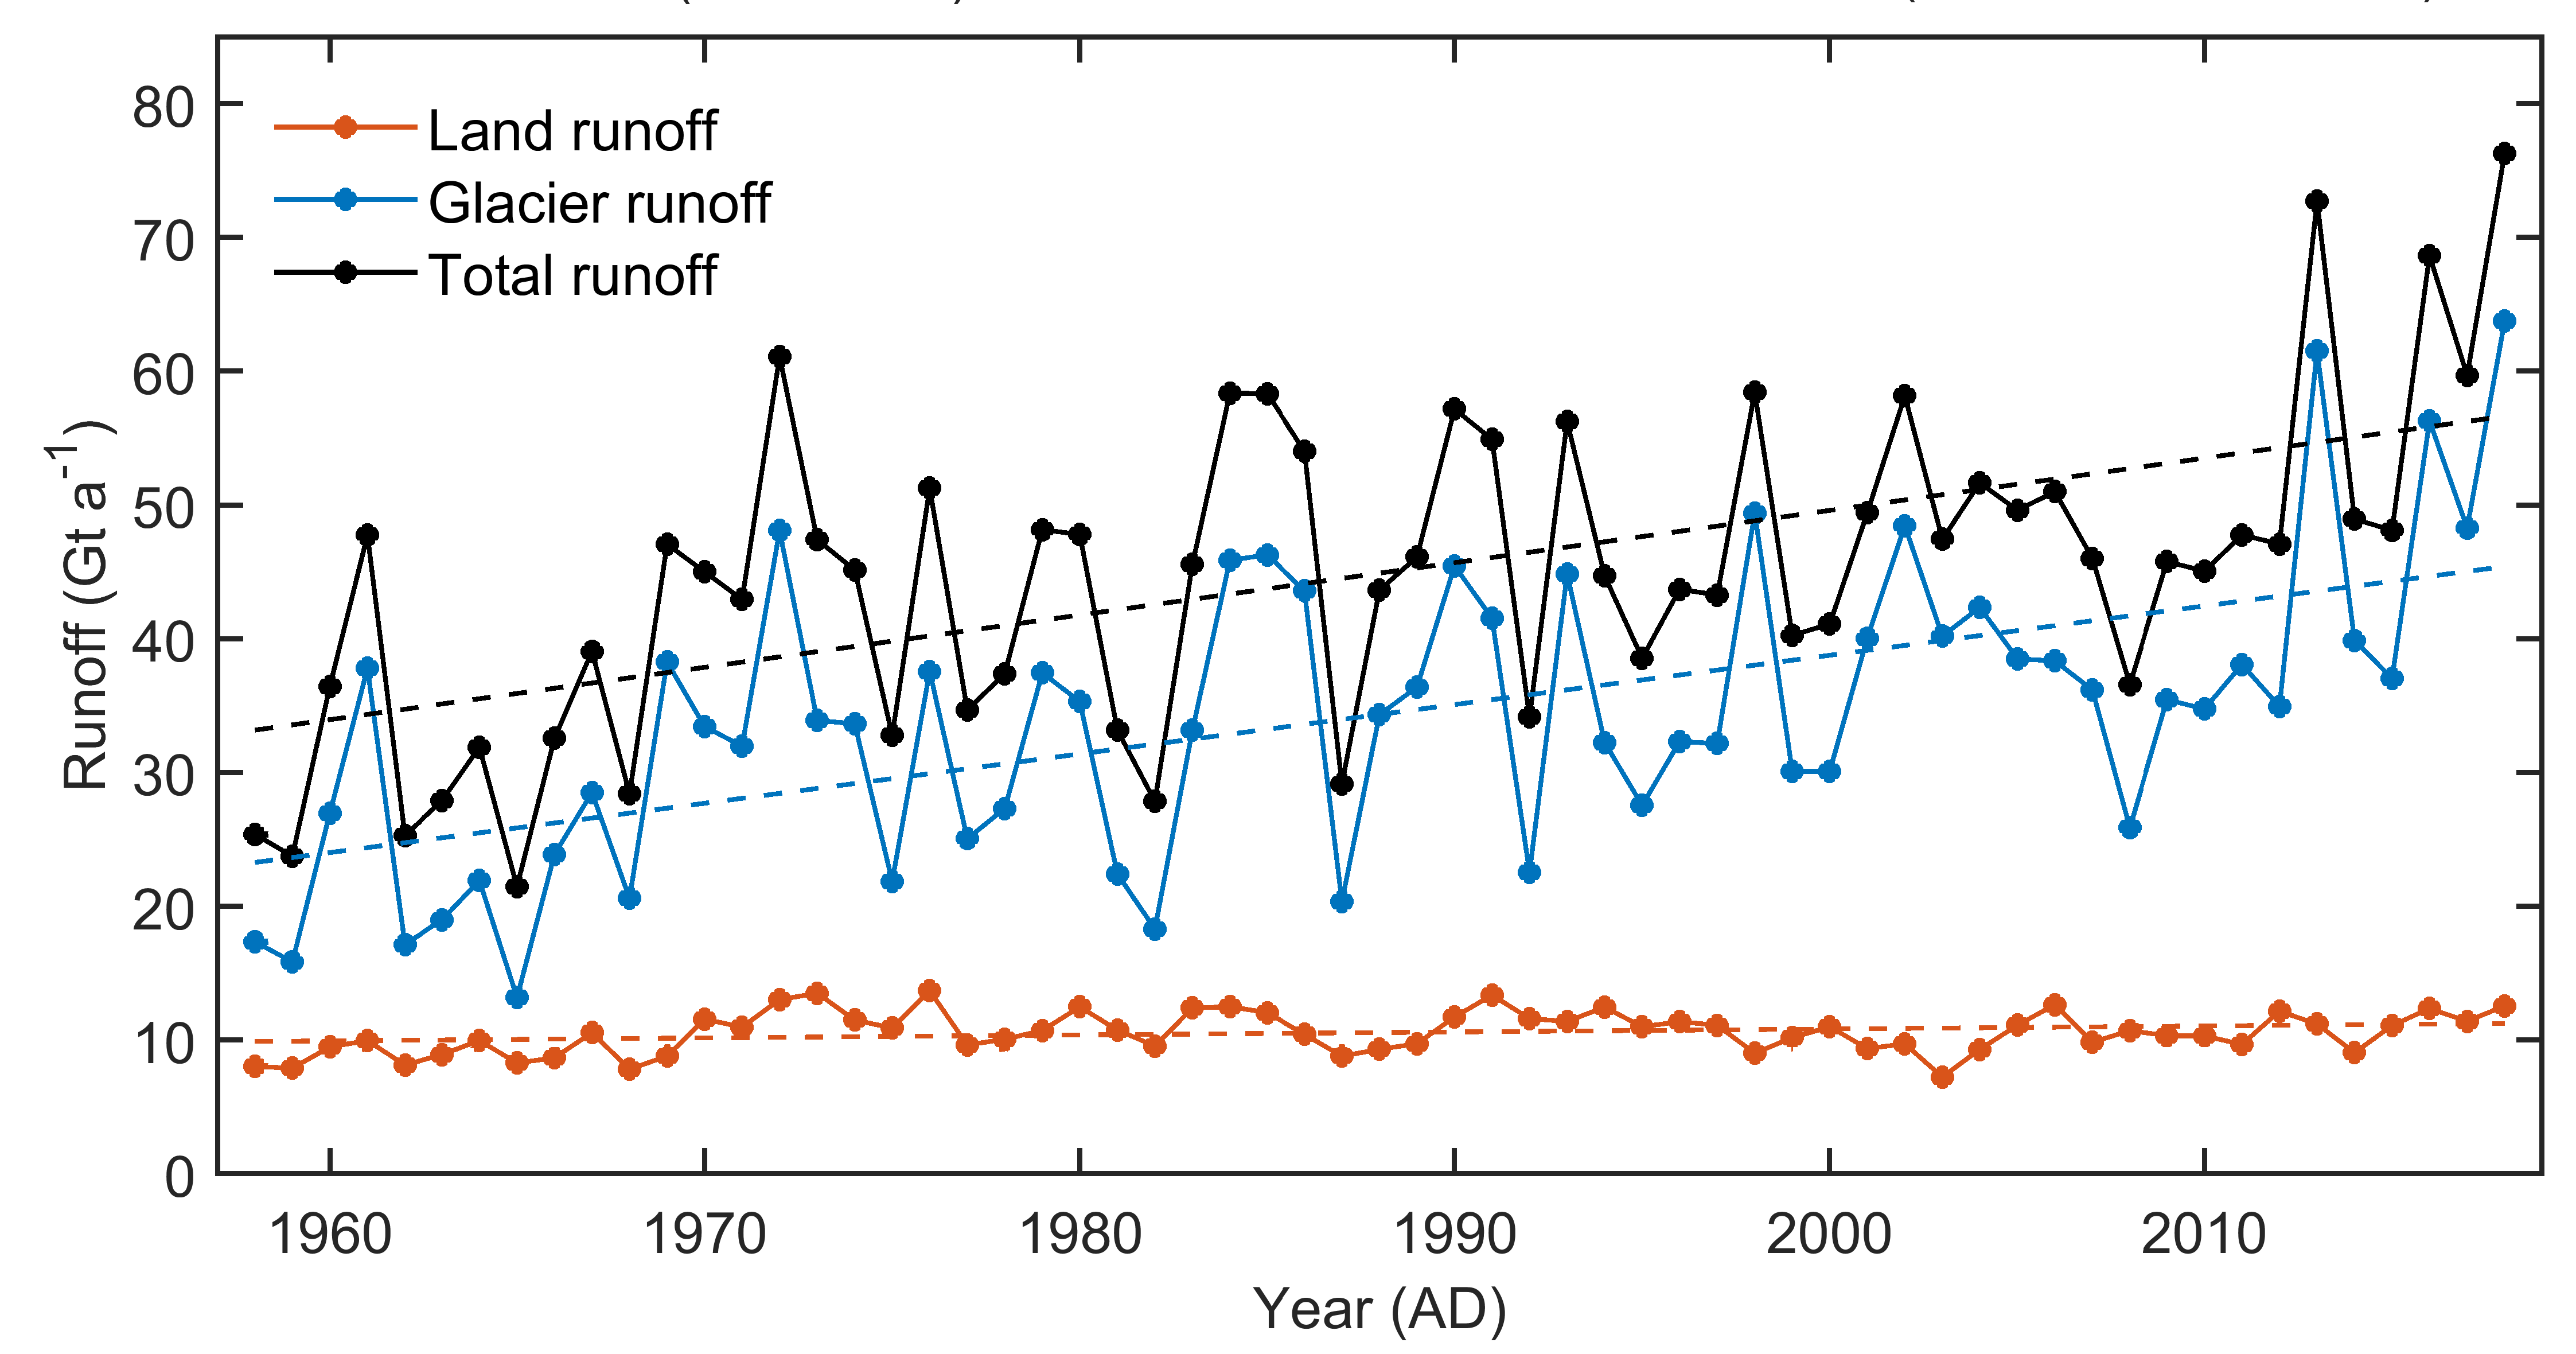
The climate in Svalbard is undergoing amplified change compared to the global mean. This has major implications for runoff from glaciers and seasonal snow on land. We use a coupled energy balance–subsurface model, forced with downscaled regional climate model fields, and apply it to both glacier-covered and land areas in Svalbard. This generates a long-term (1957–2018) distributed dataset of climatic mass balance (CMB) for the glaciers, snow conditions, and runoff with a 1 km×1 km spatial and 3-hourly temporal resolution. Observational data including stake measurements, automatic weather station data, and subsurface data across Svalbard are used for model calibration and validation. We find a weakly positive mean net CMB (+0.09 m w.e. a−1) over the simulation period, which only fractionally compensates for mass loss through calving. Pronounced warming and a small precipitation increase lead to a spatial-mean negative net CMB trend (−0.06 m w.e. a−1 decade−1), and an increase in the equilibrium line altitude (ELA) by 17 m decade−1, with the largest changes in southern and central Svalbard. The retreating ELA in turn causes firn air volume to decrease by 4 % decade−1, which in combination with winter warming induces a substantial reduction of refreezing in both glacier-covered and land areas (average −4 % decade−1). A combination of increased melt and reduced refreezing causes glacier runoff (average 34.3 Gt a−1) to double over the simulation period, while discharge from land (average 10.6 Gt a−1) remains nearly unchanged. As a result, the relative contribution of land runoff to total runoff drops from 30 % to 20 % during 1957–2018. Seasonal snow on land and in glacier ablation zones is found to arrive later in autumn (+1.4 d decade−1), while no significant changes occurred on the date of snow disappearance in spring–summer. Altogether, the output of the simulation provides an extensive dataset that may be of use in a wide range of applications ranging from runoff modelling to ecosystem studies. Please find the article here: link